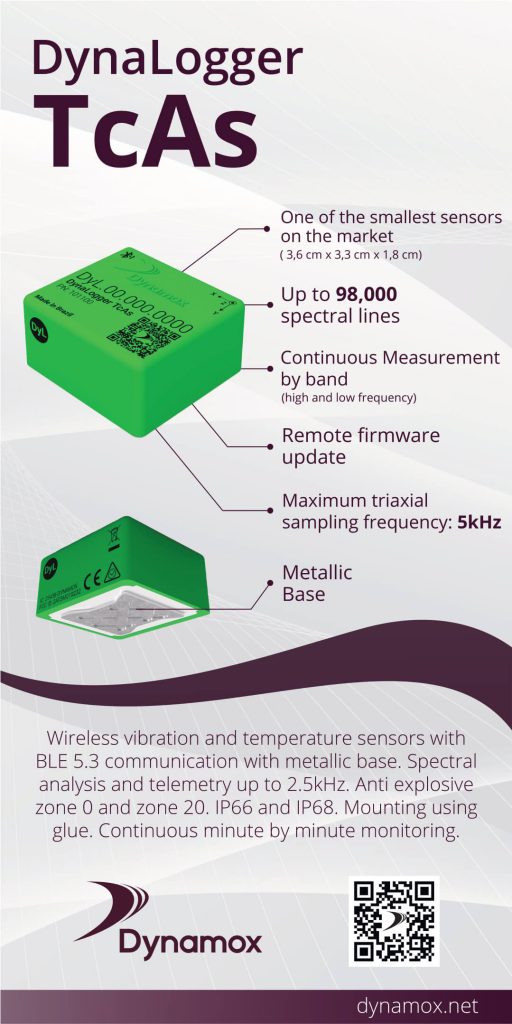
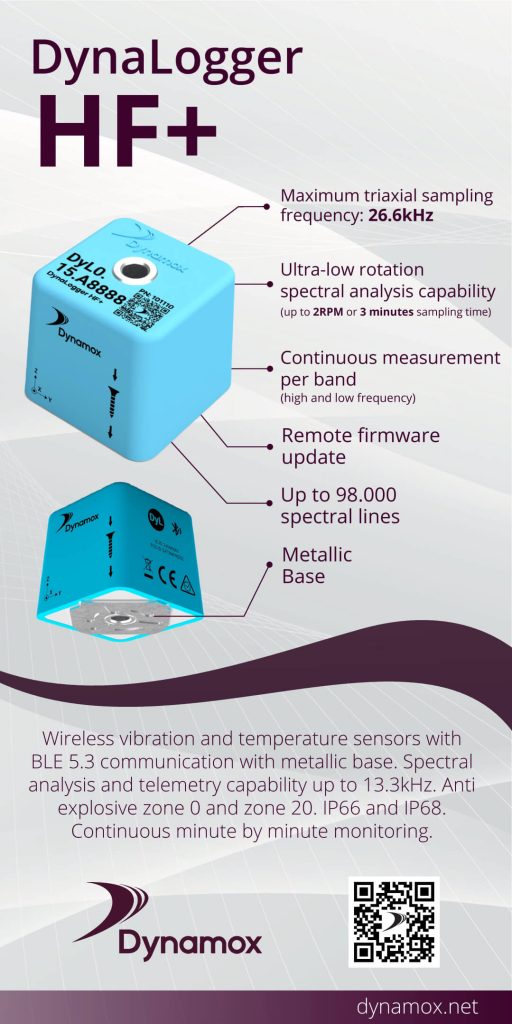
Why perform wireless monitoring on industrial assets?

Machinery protection and ability to measure hard to reach spots with limited access

Safely keeps employees away from rotating equipment

Remote and Automated data collection

Quick to deploy with low implementation and maintenance costs compared to wired systems

Frequent collections (1min intervals) with data history available online

Data stored in the cloud and various integration possibilities available
DynaPredict Solution
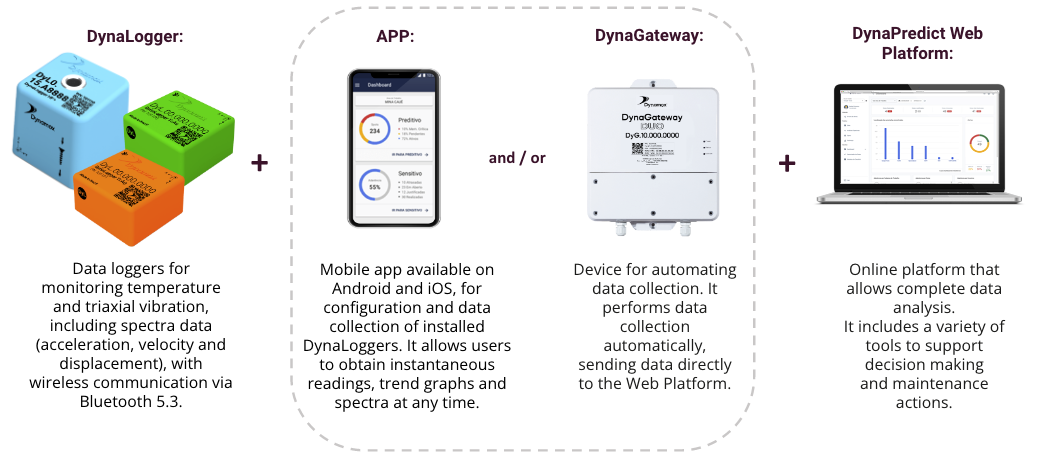
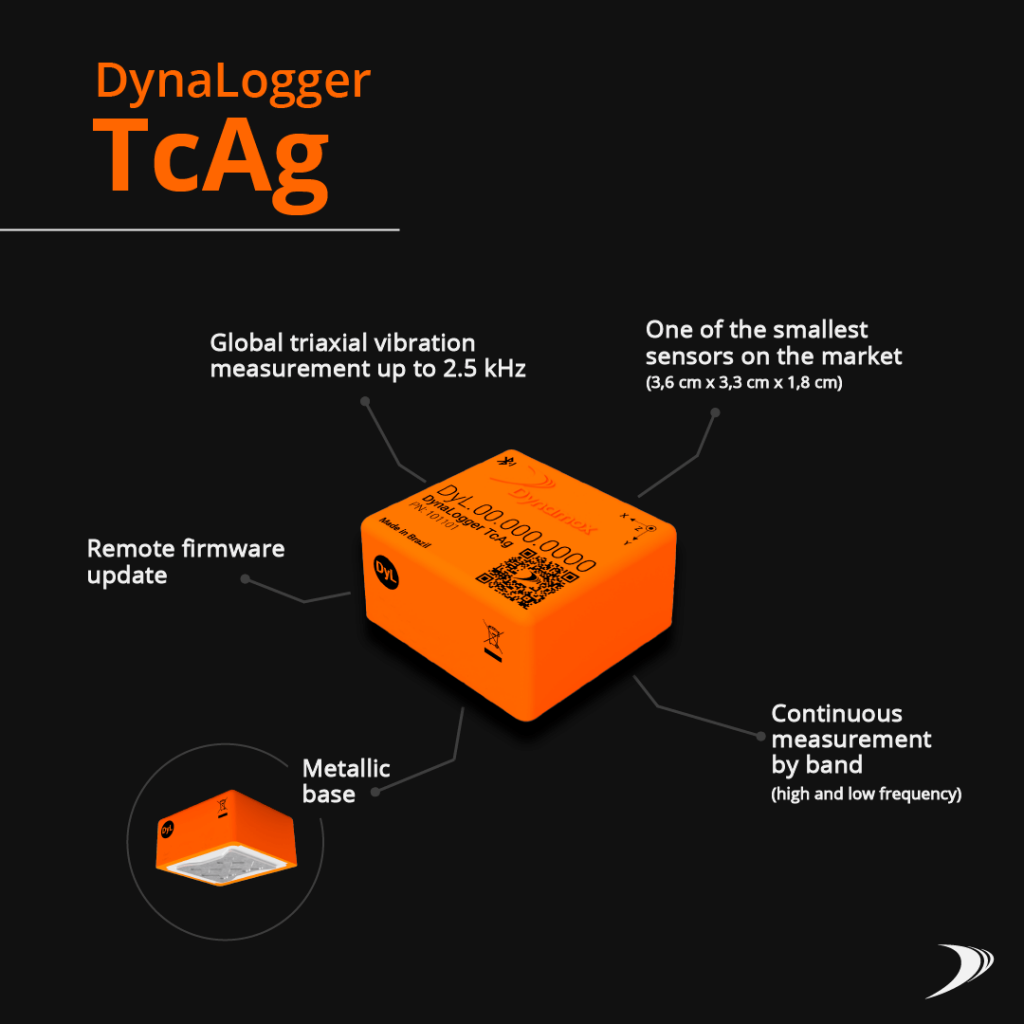
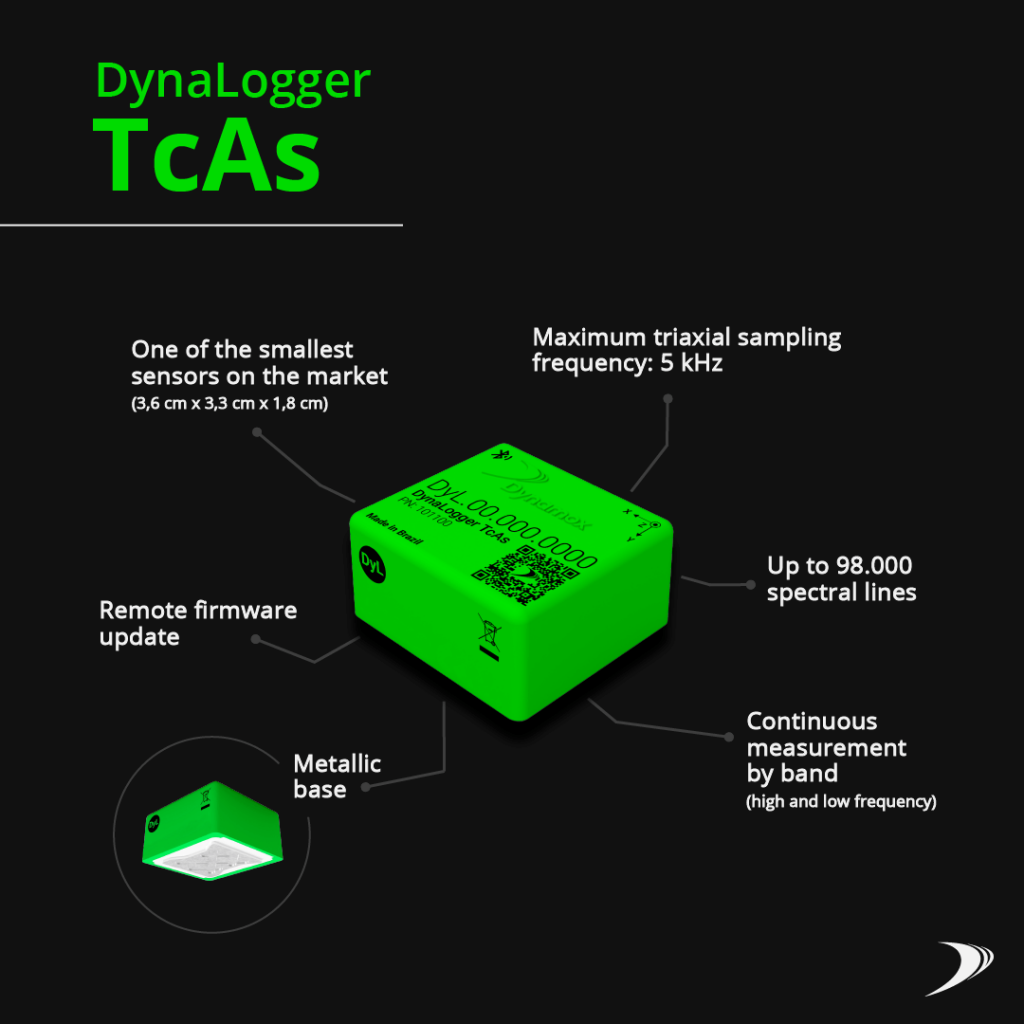
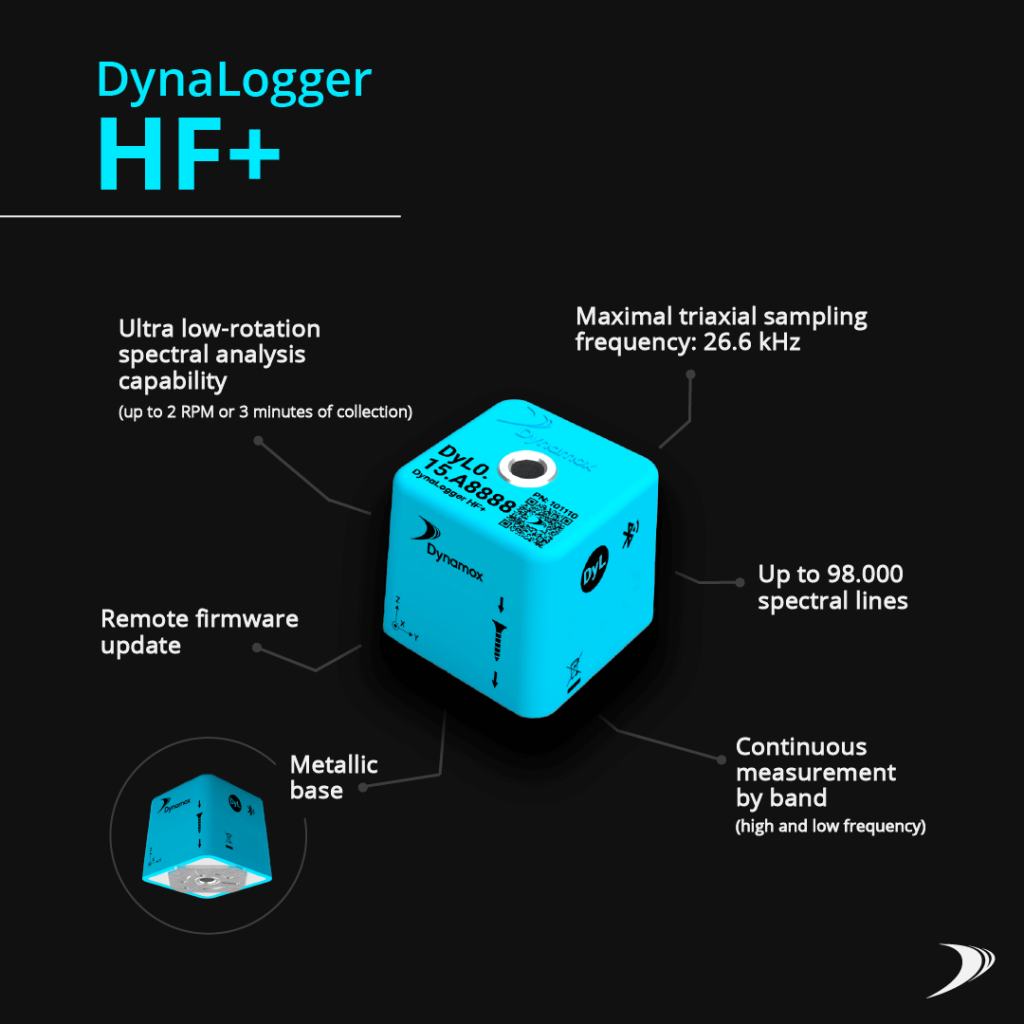
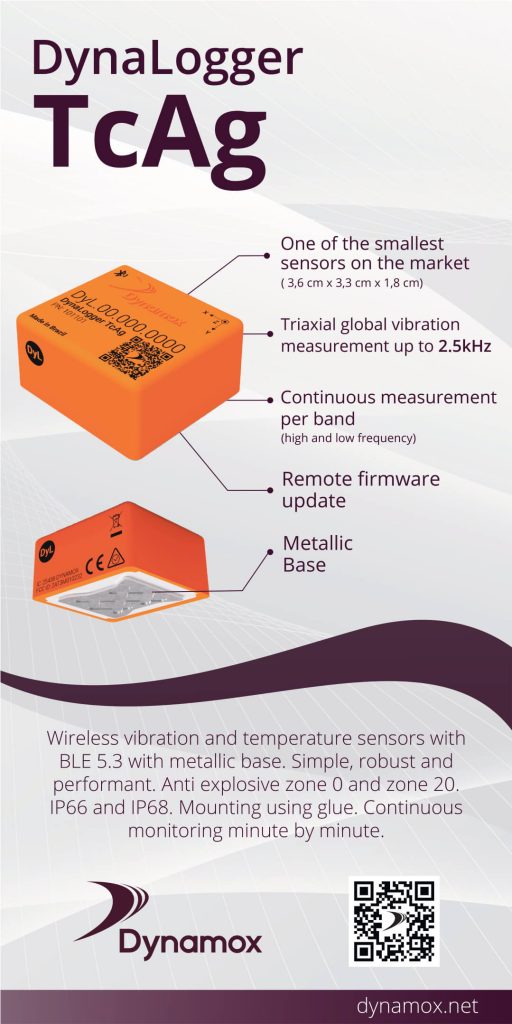
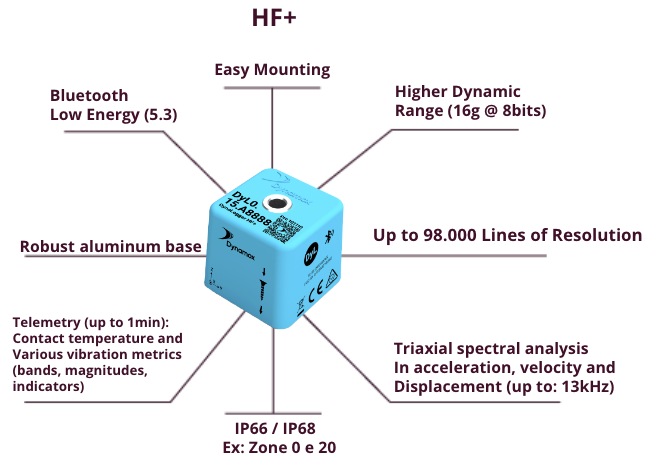
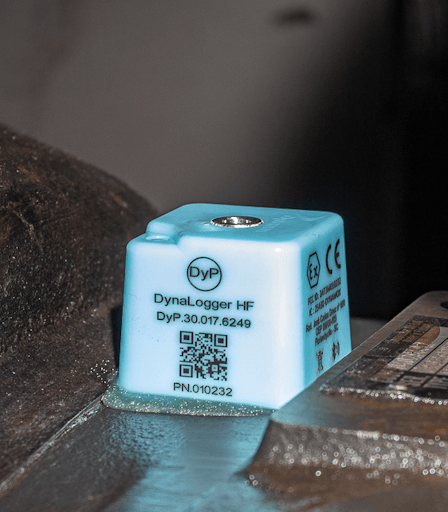
Dynaloggers
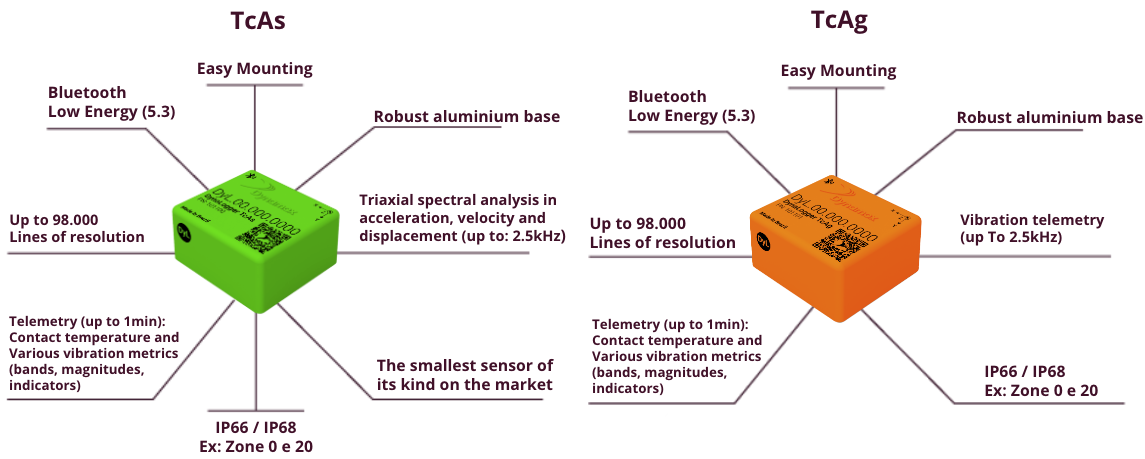
Mounting
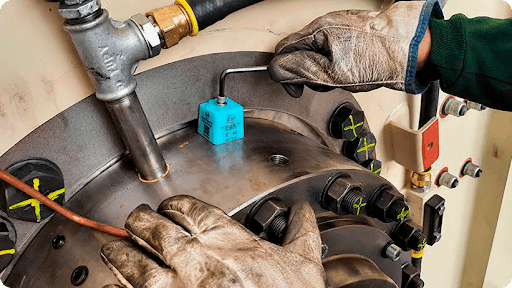
The DynaLogger can be screwed or glued to the monitoring locations.
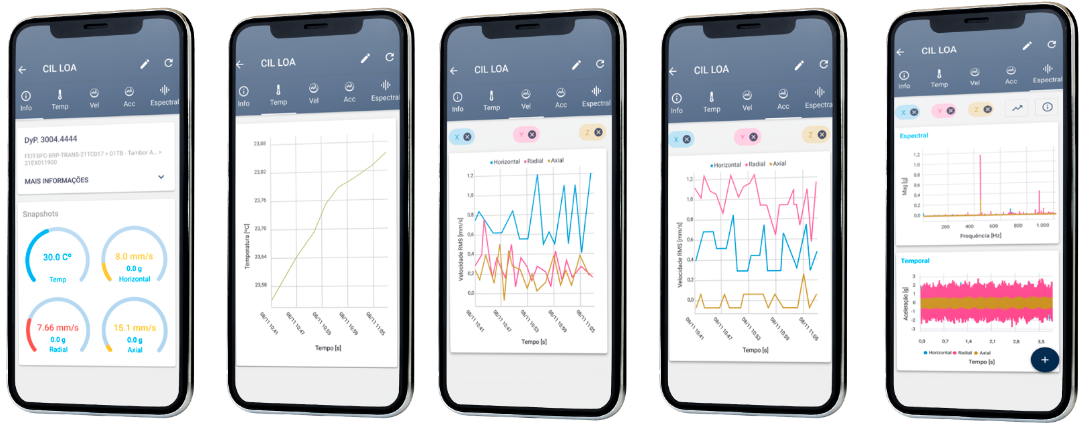
Mobile App
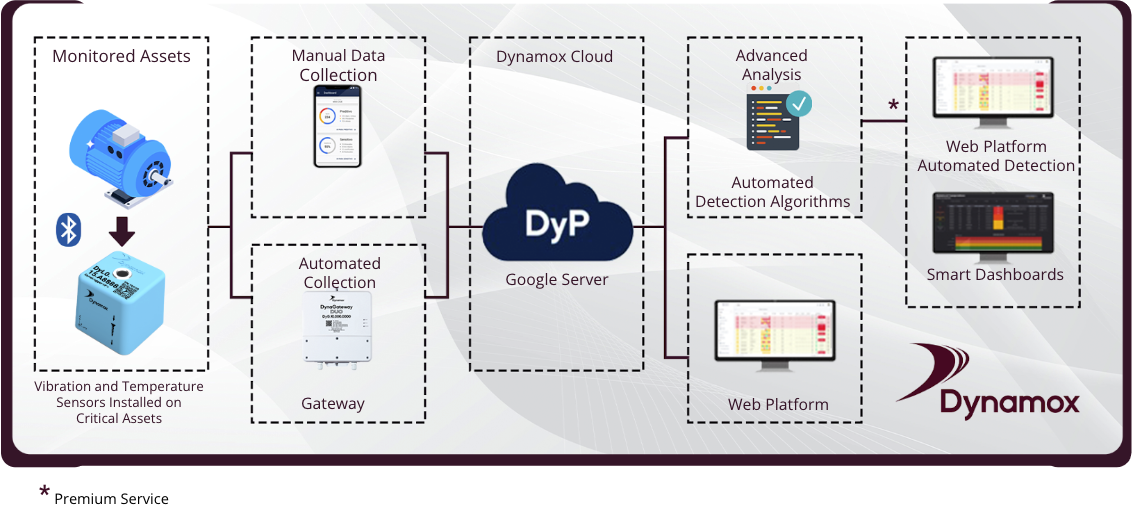
Manual Collection: The app is able to configure DynaLoggers and collect data via Bluetooth.
- Instantaneous vibration and temperature readings.
- Collection of vibration spectra with maximum frequency choice and waveform duration.
- Collected data is sent to the Web Platform.
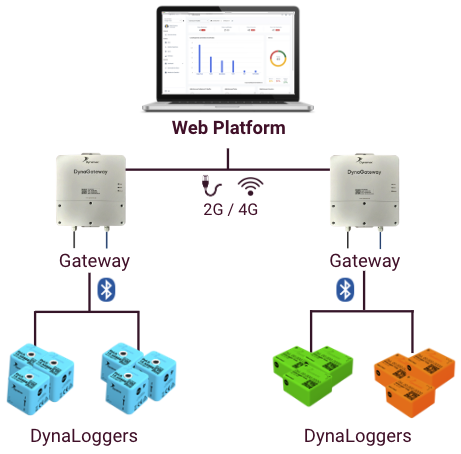
Gateway: Automated Detection
- Automation of data collection from multiple DynaLoggers within Bluetooth range.
- Collected data is sent directly to the DynaPredict Web Platform via Wi-Fi, Ethernet or mobile network.
- Configuration of data collection periodicity for each DynaLogger within Bluetooth range.
- Alterations on the Dynaloggers’ settings can be done remotely.
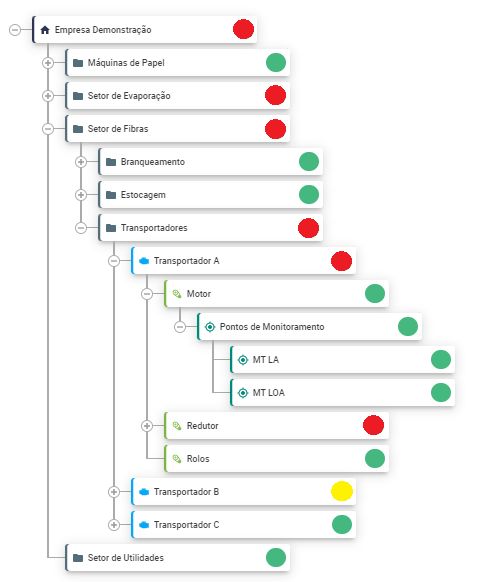
Web Platform: Asset Tree
- Hierarchical organization of monitored plants and assets.
- User management, with access restrictions and different profiles (admin, editor, collector and reader).
- Managers can have full access to different plants, being able to manage different plants or sectors remotely.
- Vibration analysts can remotely analyze monitored spots located at different plants of the organization.
Vibration and Temperature Data History
- Graphs with a history of temperature, velocity and RMS triaxial acceleration measurements that allow the identification of changes in the machine’s operating pattern, due to the appearance or evolution of failures.
- Moving average and statistical tools to help understand the behavior of the monitored equipment.
- Information about machine operation, such as operating time, downtime, etc.
- Timeline with events that occurred at the monitored spot.
- Alarms configured to monitor machine vibration and temperature levels and also alert users of evolutions.

Vibration Analysis Tools ( 1/2 )
- Waveform and frequency spectrum.
- Data available in the acceleration, velocity and displacement domains.
- High pass, low pass and band pass filters.
- Spectral trend plots for clear visualization of failure evolution.
- Waterfall for spectra comparison.
- Circular waveform.


Vibration Analysis Tools ( 2/2 )
- Cursors and markers to highlight frequencies that can be registered on each machine.
- Rolling bearing database with approximately 70 thousand registered models.
- Autocorrelation to highlight recurrences in signals.
- Envelope with free choice of filter ranges.
- Cepstrum and Cepstrum waterfall.
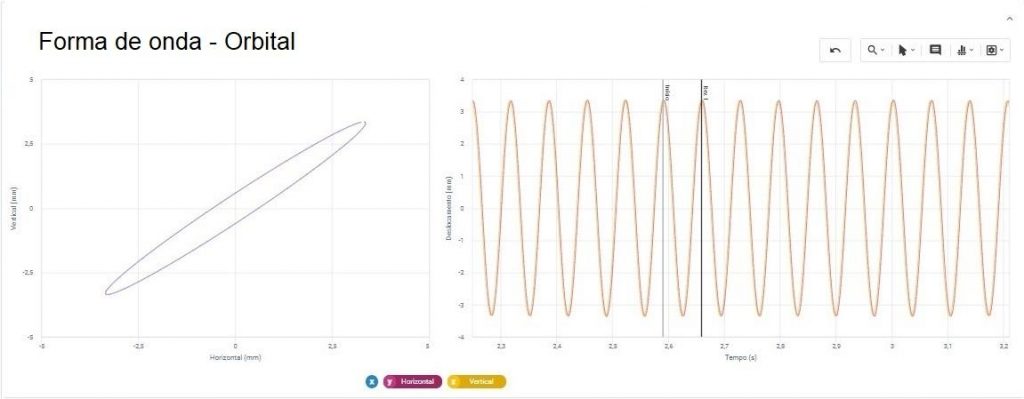
- Orbital plots.


How to prioritize the spot’s ( sensor ) analysis?
Decision-Making Assistant Dashboard: with compact information that sorts the monitored spots.
- Visual prioritization according to configured alarms:
RED: points with the most critical alarm (A2) violated.
YELLOW: points with the first level of alarm (A1) violated.
GREEN: points without violated alarms. - Average values of temperature and vibration, as well as percentages of evolution.
- Alert trend and evolution of the last 7, 14, 30 and 120 days.
- Predictability in days for warning the violation of configured alarms.
- Battery and last synchronization information for each monitoring spot.

Predictive Reports
- Analysts can create predictive analysis reports, pointing out needed interventions.
- Identified failures and suggested recommendations can be registered in each report.
- Analysts can add images and graphs to show what is being identified.
- Reports are saved on the Web Platform and are available on the timeline of each spot.
- It is possible to download the reports as PDF files.
- Reports are available for all users, making it possible for everyone in the company to see the identified failures and which are the spots with reported problems.

DynaPredict
Certifications

George McMurtry
BDM Instrumentation & Digital Solutions
Intercom m: 0492 975 461
e: george.mcmurtry@intercomgroup.com.au
w: intercomgroup.com.au
BDM Instrumentation & Digital Solutions
Intercom m: 0492 975 461
e: george.mcmurtry@intercomgroup.com.au
w: intercomgroup.com.au


